Intraday trading is fast-paced.
You’ve got to make quick decisions, work under pressure, and take the heat every.single.day.
Is this what you want?
Then you’re in the right place.
Because in today’s post, you’ll discover my 7 best intraday trading tips I’ve learned back as a prop trader.
(These are the stuff winners pay attention to that losers ignore).
You ready?
Then let’s begin!
Not all markets are the same. Here’s what you must know…
Here’s the thing:
If you’ve read Technical Analysis books, most tell you the market trends 30% of the time.
But recently, I’ve discovered it’s not entirely true.
In fact, some markets trend better than others.
Let me prove it to you…
I applied a simple Trend Following strategy to different markets.
Here’s how it works…
- Buy the breakout of previous day high
- Hold the long position till the price hits the previous day low, and go short
- Hold the short position till the price breaks above the previous day high, and go long
- Rinse repeat over again
Now, I’ve applied this strategy to a portfolio of markets.
And here are the results of two markets that proves my point…
GBP/USD: Equity curve in an uptrend when a Trend Following approach is traded on it.
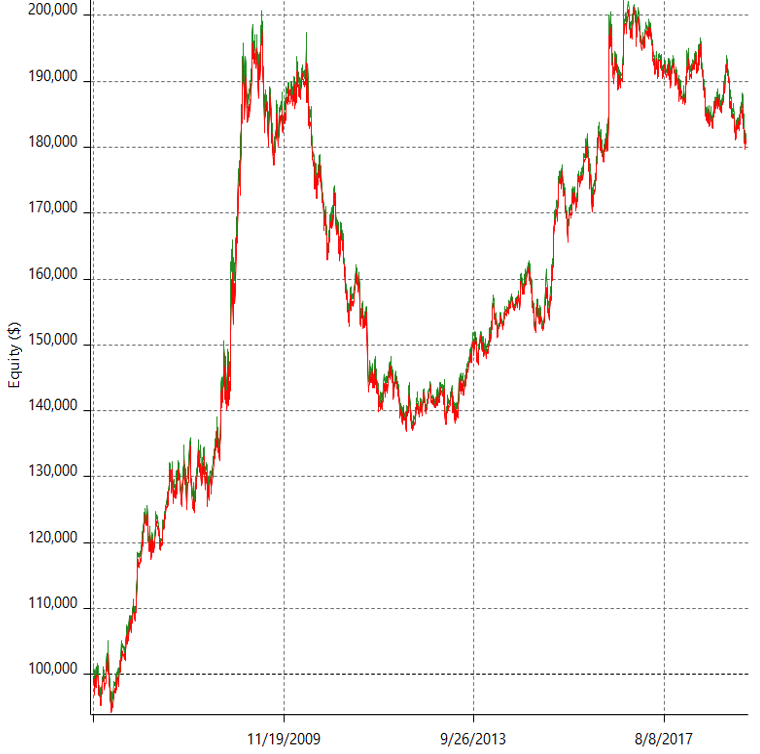
You see an equity curve that’s moving higher.
This tells you GBP/USD is a trending market as it makes money when a Trend Following approach is traded on it.
AUD/CAD: Equity curve making new lows when a Trend Following approach is traded on it.
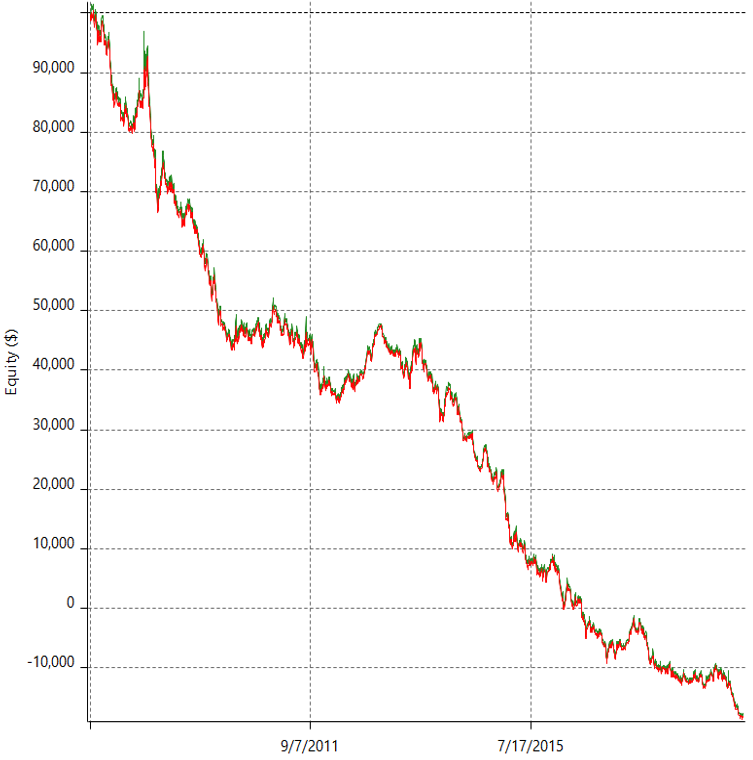
Now, you see an equity curve that’s heading lower.
Clearly, AUD/CAD is a mean reverting market as it loses money when a Trend Following approach is traded on it.
So, the lesson is this…
Not all markets are created equal.
As an intraday trader, it’s important to know whether the markets you trade has a trending or mean-reverting behaviour.
Once you know, then you can use the appropriate trading strategy for it.
Next…
Intraday trading: How to tell when the market is exhausted
Now:
The market is like a car running on a gas tank.
It can go only go so far before it exhausts itself.
So, the question is…
How do you know when the market is exhausted?
You can use an indicator like the Average True Range (ATR) and observe its historical volatility
Here’s what I mean…
EUR/USD: Daily ATR
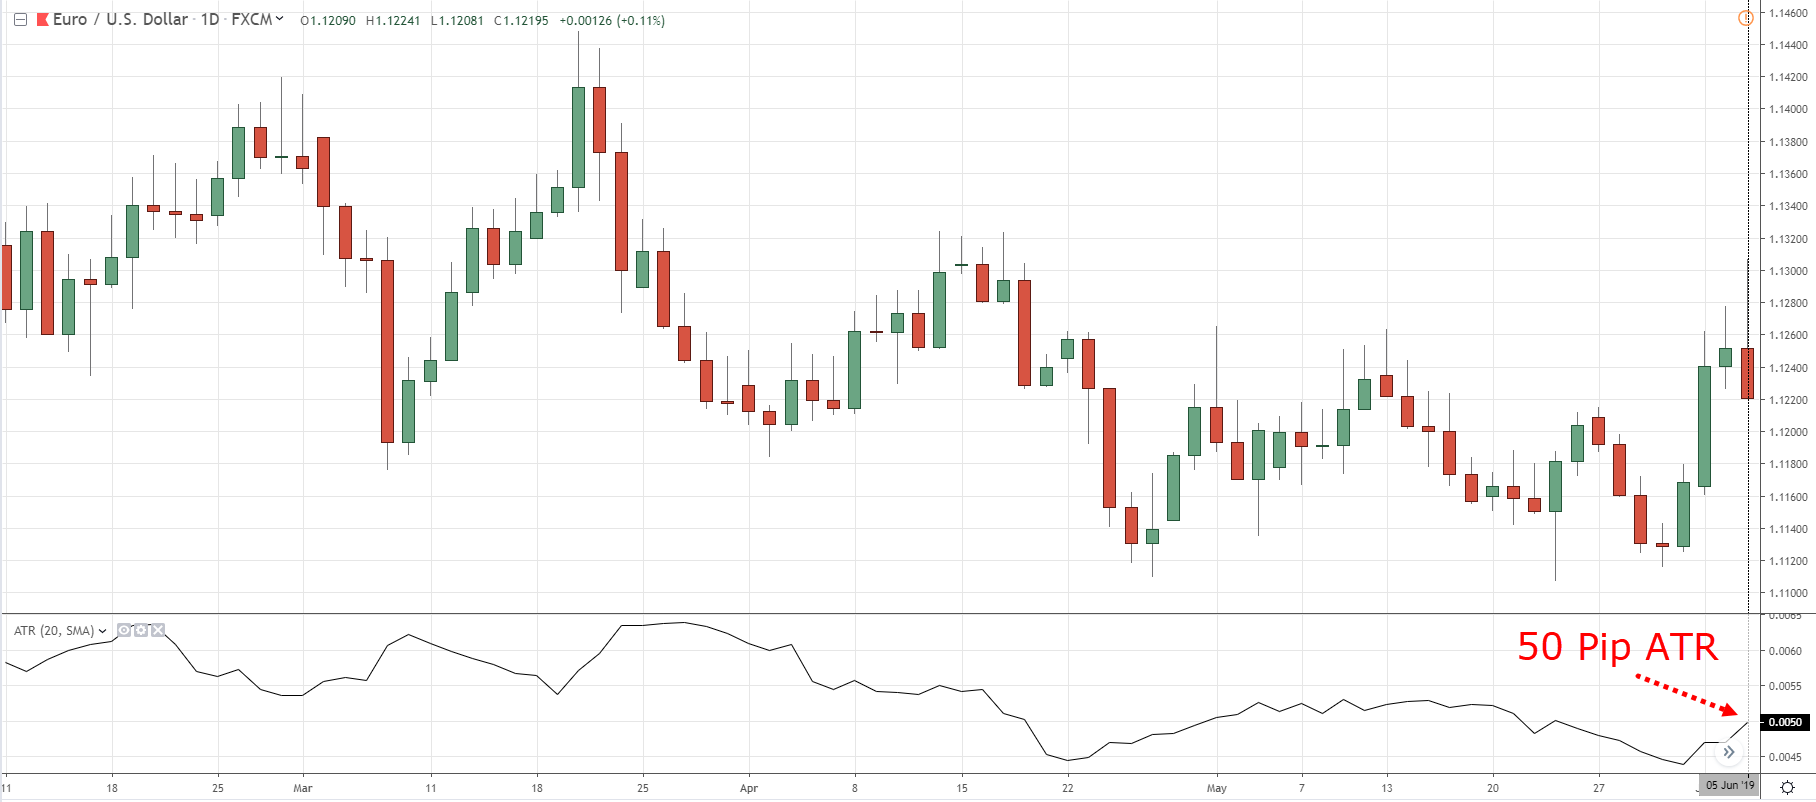
As you can see, EUR/USD has an ATR of 50 pips a day.
This means on average, EUR/USD moved about 50 pips a day (from the highs to the lows).
Now, it doesn’t mean EUR/USD will reverse whenever it makes a 50 pip move for the day because it can “stretch” further than 50 pips.
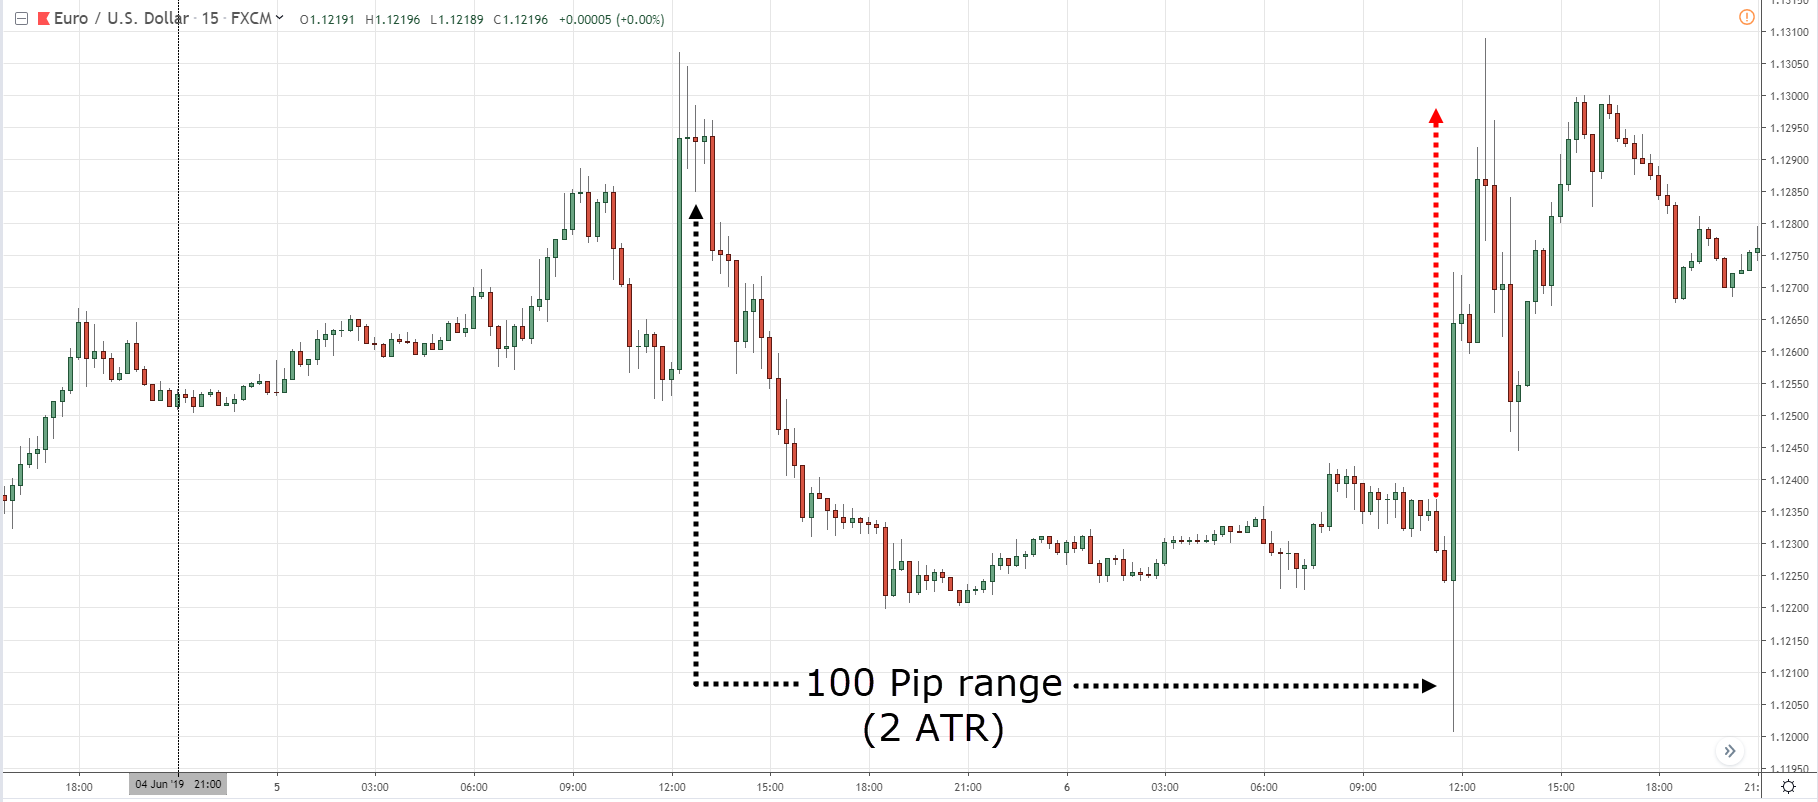
But as a guideline, if a market has moved 2 ATR for the day, it’s probably exhausted and unlikely to make new highs/lows.
Here’s an example…
EUR/USD 15mins: The price reverses after reaching 2 ATR
Does it make sense?
How to identify market turning points ahead of time
Intraday trading is fast paced.
A level that’s respected a few days ago might be useless now so you must re-draw your levels regularly.
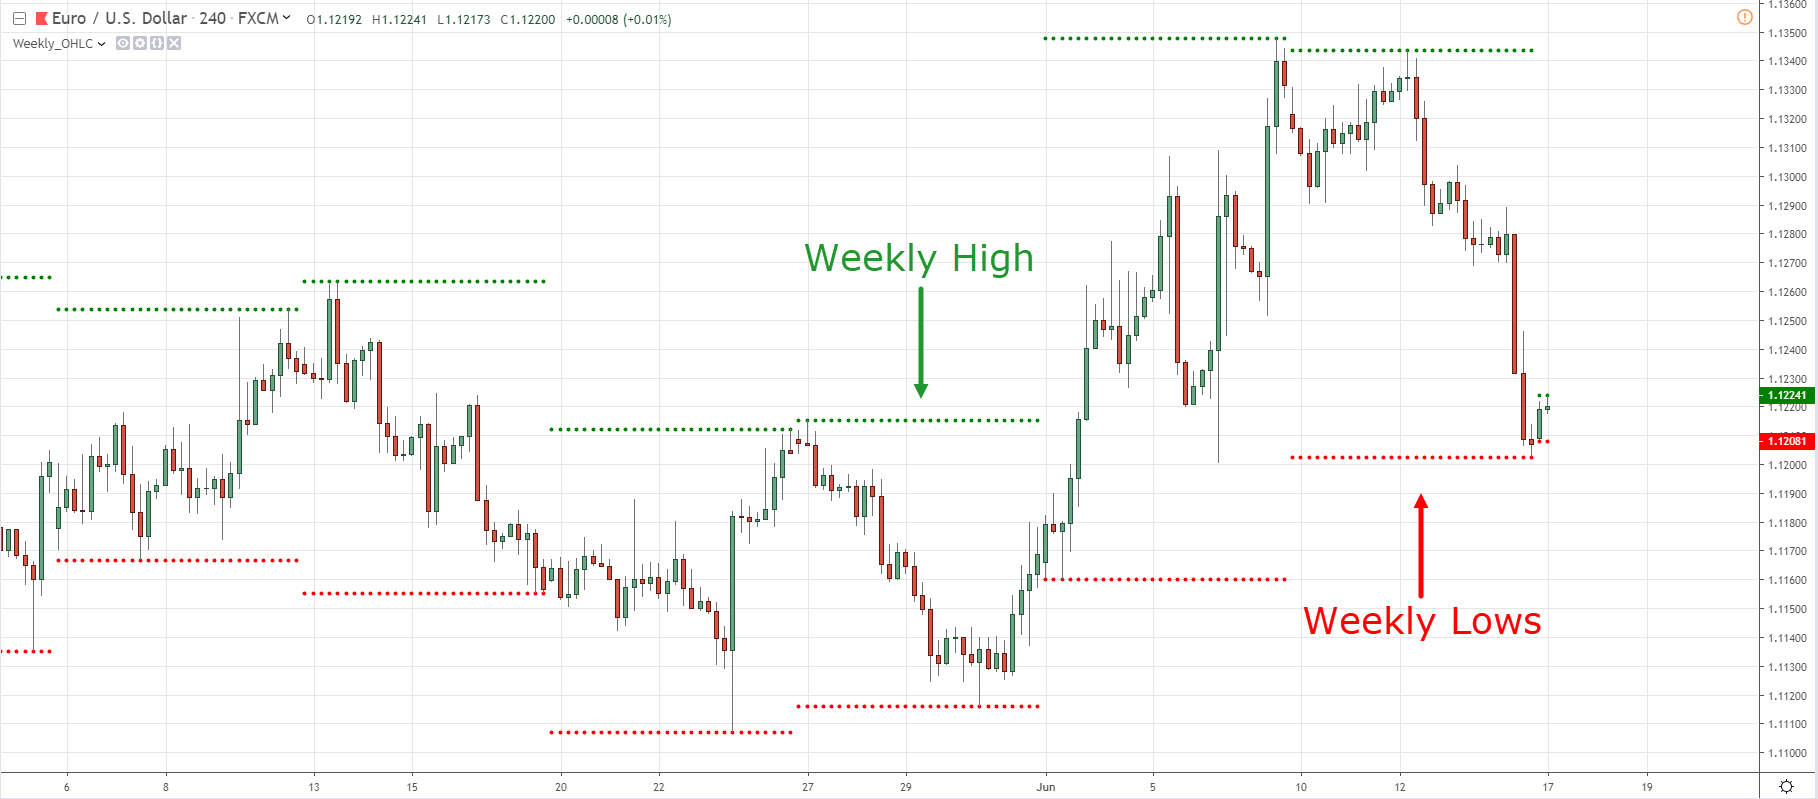
Now, one thing I found useful in my prop trading days is to identify the previous week’s high/low.
Why?
Because that’s the point of extreme optimism/pessimism (for the week) before the reversal occurs.
And this is future reference points where the market could find Support and Resistance.
So, here’s how you draw it…
- Identify the previous week high and low
- Then draw a horizontal line across it, and that’s it
Here’s an example…
Pro Tip #1:
You can get this indicator for free in TradingView. Just search for “Weekly_OHLC” under the indicators tab.
Pro Tip #2:
Mean reverting markets like AUD/CAD, AUD/NZD, USD/CAD respects the previous week high/low better than other Forex pairs.
How to tell when the market is about to make a big move
Here’s the deal:
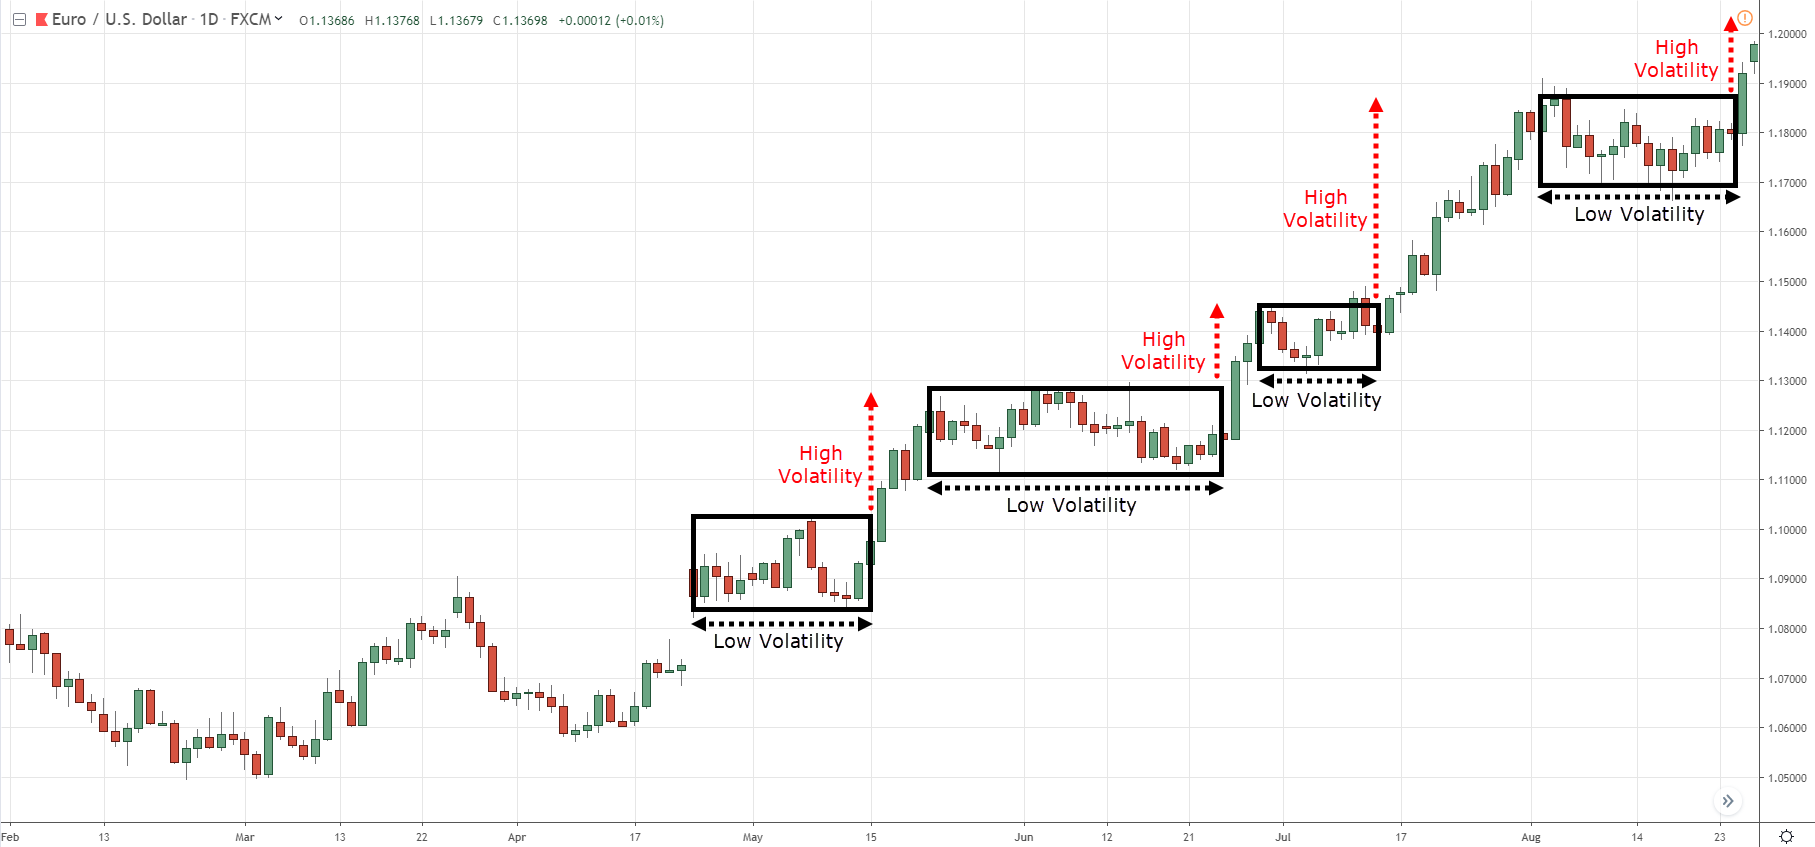
The volatility of the markets is always changing.
It moves from a period of low volatility to high volatility and vice versa.
This means if the volatility of the previous few days is low, then expect volatility to expand soon.
Here’s an example:
So, how do you use this knowledge for intraday trading?
Simple.
#1 Have a more aggressive target profit
If you’ enter a trade during a low volatility environment, you want to consider having a further take profit level as the price could really move in your favour when volatility expands.
One way is to take half of your profits at 1:1 risk-reward ratio and let the remaining half ride with a trailing stop loss.
#2 Don’t trade against the breakout
Now…
When the price breaks out from a low volatility environment, it can move fast.
So, don’t trade against the breakout (unless you know what you’re doing).
Why the volatile hours are your money-making opportunities
Look at the different market sessions below…
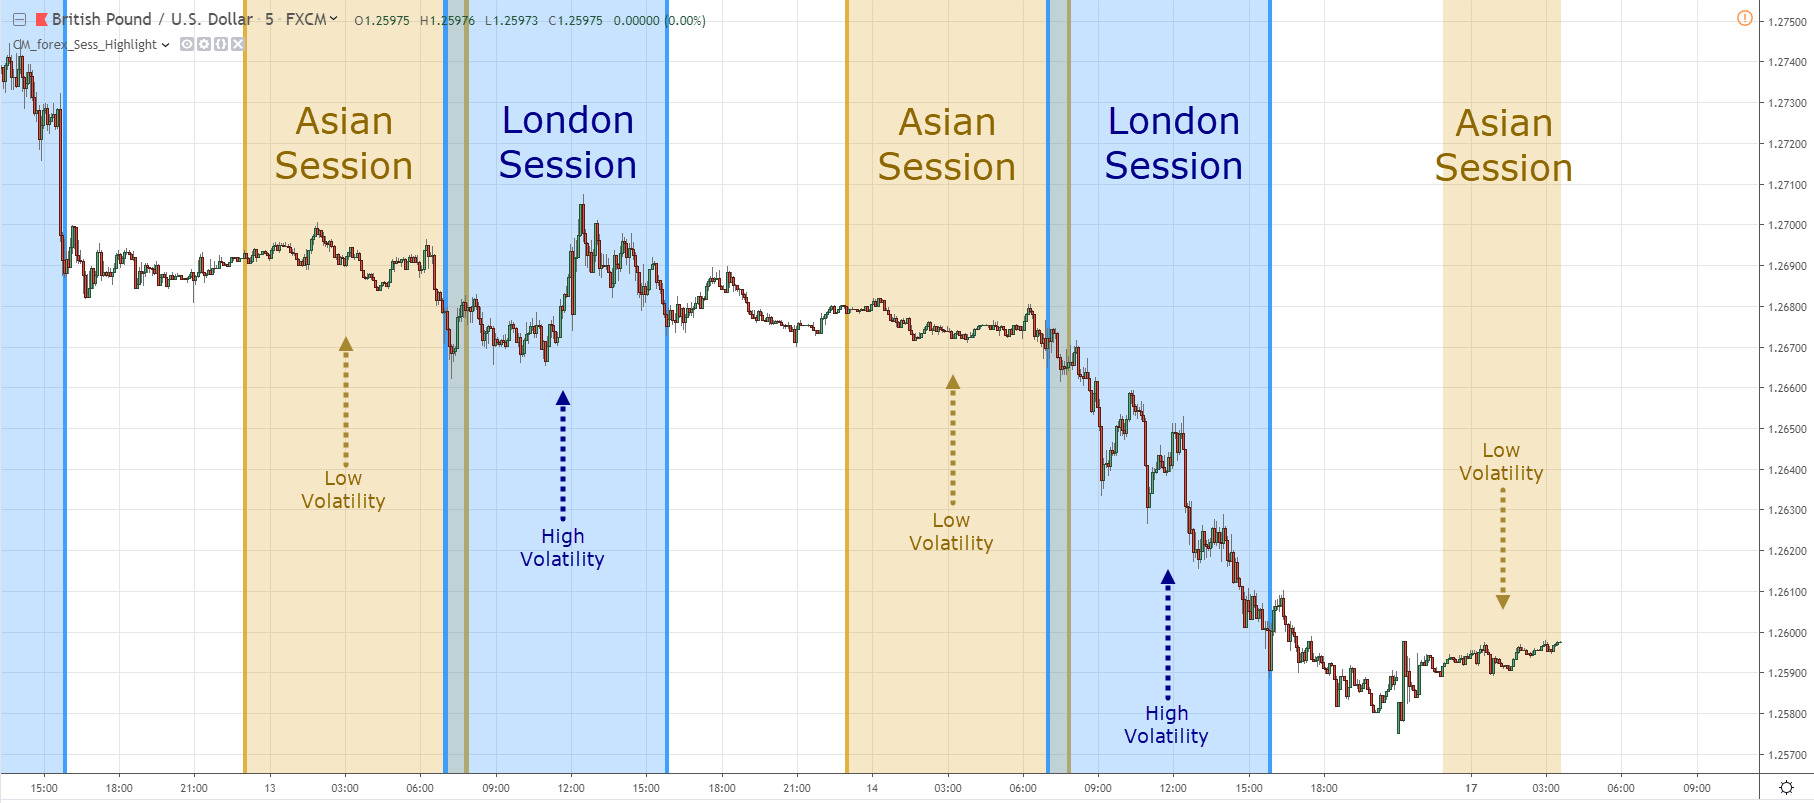
Now, let me ask you…
Which session is more profitable to trade?
The London session, right?
Because the market is volatile during this period which offers more trading opportunities.
For example:
If the market has a trending behavior, then you’d want to be trading trend continuation trades or breakouts.
Or if the market has a mean-reverting behavior, then you can look to fade the previous day high/low as a counter-trend trade.
There are many ways to skin a cat, but before you skin the cat, you must know when the cat comes out — which for most Forex pairs is during the London session.
You must know when a major news release is coming out, or else…
You’ll get stopped out of your trades repeatedly.
Here’s why…
During major news release, the spread widens because there’s a lack of liquidity in the markets (and no it’s not your broker trying to hunt your stops).
So, if your stop loss is near the current market price, you’ll likely get stopped out on the major news release.
So, what can you do about it?
#1: Exit your position before the major news release
What you can do is exit your position before the major news release.
And when the spread becomes normal again, you can re-enter your position if the trading setup is still valid.
Now there’s a catch to this.
Sometimes the news could push the price further in your favour and you’re on the sidelines (because you exited the trade earlier).
#2: Widen your stop loss to withstand the price swing
Alternatively, you can widen your stops to withstand the sudden news spike.
Now, the downside to this is you might lose more than your initial risk.
So, what you can do is reduce your position size on the trade.
For example:
If you have 1 lot short on EUR/USD with a stop loss of 50 pips.
You can consider reducing your lot size to 0.5 lot and increasing your stop loss to 100 pips.
This way, even if you do get stopped out, it’s still within proper risk management.
Does it make sense?
Awesome!
How to identify insanely profitable intraday trading opportunities with low risk
Here’s a fact:
Support and Resistance (SR) on the lower timeframe isn’t as significant compared to the higher timeframe.
This means a bounce off SR on the lower timeframe is likely to move 20-30 pips whereas a bounce of SR on the higher timeframe can move a few hundred pips.
Now you might be thinking…
“But how do I use it to find insanely profitable intraday trading opportunities?”
Here’s how…
- Let the price approach Support/Resistance on the higher timeframe (e.g. Daily)
- Wait for a break of structure on the lower timeframe
I’ll explain…
1. Let the price approach Support/Resistance on the higher timeframe (e.g. Daily)
Be patient and let the price come to a key Support area on your chart.
Here’s an example: The price at Support area on the Daily timeframe
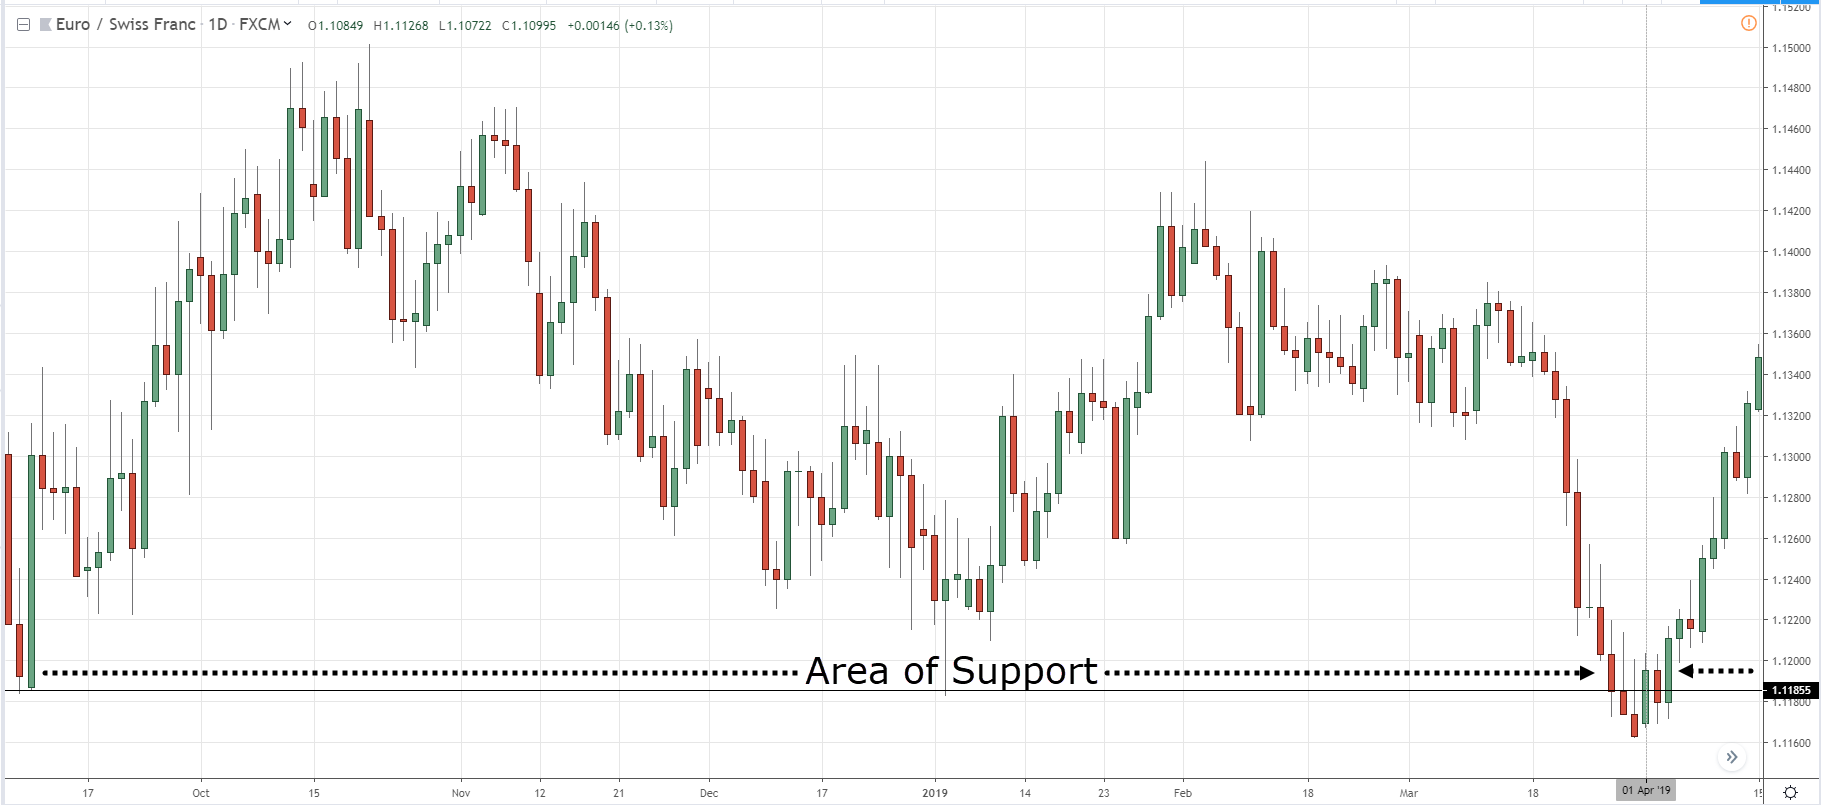
Next…
2. Wait for a break of structure on the lower timeframe
At this point, you’ll see a series of lower highs as the sellers are in control.
So, what you’re looking for is a break of structure, where the price makes a higher high and higher low (signaling the buyers are in control).
Here’s what I mean: Higher highs and lows leaning against the higher timeframe Support
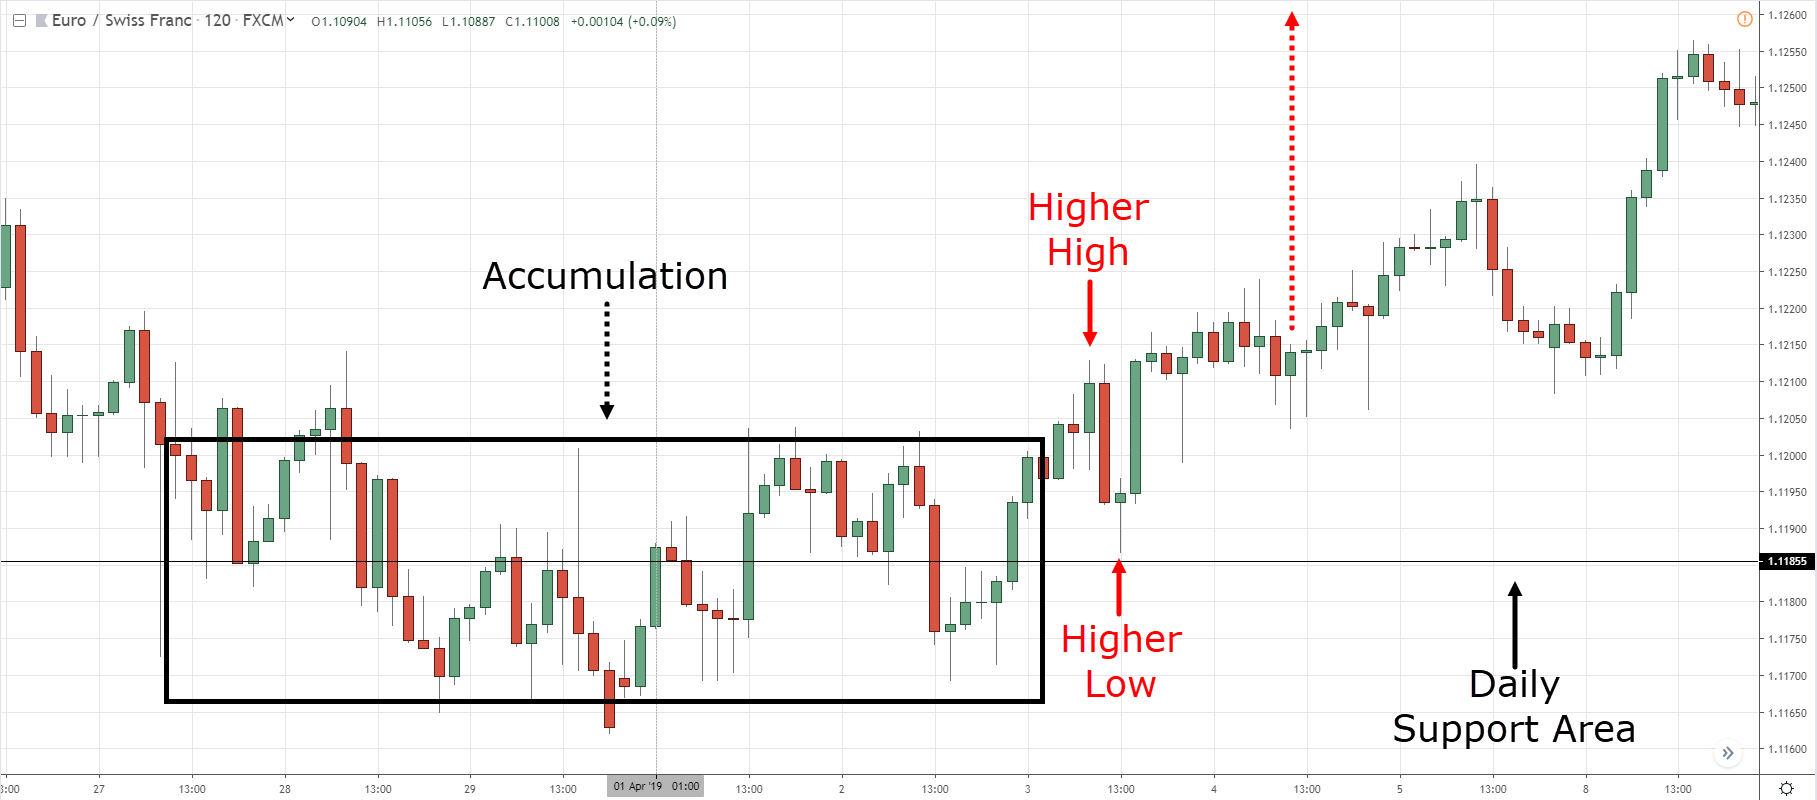
Once you get a break of structure, you can go long and ride the potential move higher.
Conclusion
So, here’s what you’ve learned:
- You must know the behaviour of the markets you’re trading; some have trending behaviour and some a mean-reverting behaviour
- The market is unlikely to exceed 2 ATR in a day. So, you can use it as a gauge to determine how far the market can potentially move in a day.
- The previous week high/low are important levels to pay attention to
- If the volatility of the markets is low over the last few days, then expect volatility to expand soon
- You want to trade during the most volatile hours of the session
- Be aware of major news release as the spread tends to widen (and you could get stopped out of your trades)
- If you want low risk and high reward trading setups, then enter your trades near Support & Resistance (on the higher timeframe)
And there you have it — my 7 best intraday trading techniques that work.
Now here’s what I’d like to know…
What are some things you look for during intraday trading?
Leave a comment below and share your thoughts with me.